|
|

|
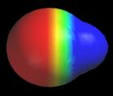
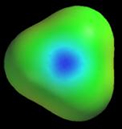
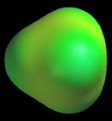
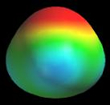
Polar H–X bonds The previous chapter showed how isodensity surfaces can be used to get information about H-X bond polarity. This information can be obtained much more easily from a potential map. The following figure shows potential maps for the same XHn molecules discussed in the previous chapter. The maps are colored using the standard color scale, and the molecules are oriented so that one H is always on the left side of the map. As you can see, the potential near hydrogen is very negative in LiH, close to neutral in BH3 and CH4, and increasingly positive in NH3, H2O, and HF. As we expect the potentials closely track the charge on hydrogen.
Although the potential near hydrogen varies systematically with the electronegativity of X, the potential near X does not. N and O are surrounded by more negative potentials than F, an unexpected result since F is more electronegative. This strange behavior is due to a combination of factors, one of which is the non-spherical shape of X (in the previous chapter we pointed out that all atoms are spherical, but they lose this shape when they make bonds). It is not hard to see how a non-spherical electron density cloud might create unusual electrostatic potentials. Consider the cartoon atoms shown below. If the nucleus is at the center of a spherical cloud (pink region), the potential is zero everywhere outside the atom (A). However, if the nucleus is set to one side of the cloud (B), or the cloud is non-spherical (C), unusual potentials are created.
Chemists refer to the regions of positive and negative potential as electron-poor and electron-rich, respectively. Thus, the red regions in the NH3 and H2O maps appear to be electron-rich. As we will see later, these regions contain nonbonding electron density. |