Tools
Faculty-developed tools
USA-Flu v1.5
We have an application modeling Influenza in the United States. You can download it here. Macintosh OS X is required. The associated paper, Space-time influenza model with demographic, mobility, and vaccine parameters,
can be found here.
Africa-HIV v1.0
This application models HIV in Africa. You can download it here. Macintosh OS X is required.
Student-developed tools
We have developed a suite of software for deep combinatorial modeling of epidemic scenarios with a variety of mathematical models. The tools are written in C and Objective C and run on Macintosh OS X versions 10.2 and later.
Preparing a simulation
The software has a modular design allowing us to use different mathematical models. The suite currently consists of three epidemic models and two tools to interact with these models. A simple front end makes it easy to run a simulation with any model. The result is then saved into a file which can be replayed with the viewer tool.
Our current models are based on a simple conflagration model and the SIR (Susceptible, Infected, Recovered) model. We have an analog variant and a digital probabilistic variant of each model. We are running the models at Reed College's Center for Advanced Computation in order to investigate the fractal nature of survivor sets discovered by the project in the previous year.
NLViewer
A smallpox simulation
NLViewer is a visual tool for observing graphical representations of simulations on a 2-D lattice. Specifically, NLViewer provides a convenient, user-friendly method of investigating computations performed with the sirmodel tools.
SIRModel front end
The front end for the SIR model simplifies the process of creating one computation using a predefined distribution or a simple radial distribution to be viewed in NLViewer.
NLViewer
NLViewer is a visual tool for observing graphical representations of simulations on a 2-D lattice. Specifically, NLViewer provides a convenient, user-friendly method of investigating computations performed with sirmodel tools.
Although NLViewer is compatible with any application that makes use of history files (.tt) and lattice snapshots (.matrix), this documentation will focus primarily on the use of NLViewer with files created by running batchrecorder.
The NLViewer Icon
A quick introduction to NLViewer
NLViewer does not perform any new computations of a model. Instead, NLViewer works like QuickTime or a VCR, displaying a visual representation of computations that were previously recorded to disk.
Contents:
- Obtaining the Sample Data
- Opening the Sample Data with NLViewer
- Examining the SIRModel Recordings
- Understanding the Details Window
- Using Fullscreen Mode
Obtaining the sample data
> Download sample data for NLViewer: NLViewerDemo.dmg
Inside this folder you'll find:
- NLViewer Application - The NLViewer application itself
- Recordings Folder - Files that can be browsed with NLViewer
- Configs Folder - The configuration files that were used to generate these recordings using batchrecorder
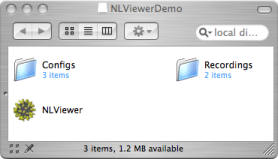
Contents of NLViewerDemo.dmg
Opening the sample data with NLViewer
> Launch NLViewer by clicking on the icon.
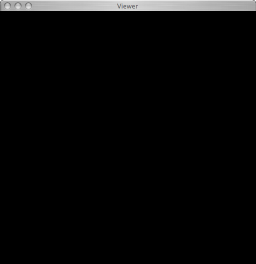
Three windows will appear:
- The Controls window contains all of the buttons etc. needed to find, play back, and examine the sample computations.
- The Viewer window is blank: the animation for a computation will appear here.
- The Details window is also blank: information associated with a computation will appear here, if any is available.
The Controls window |
The Viewer window |
|

The Details window |
> From the File menu, select Change Path to Repository.
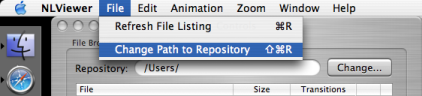
Changing the path to the repository.
> Find the volume NLViewerDemo, select it, and click Open.
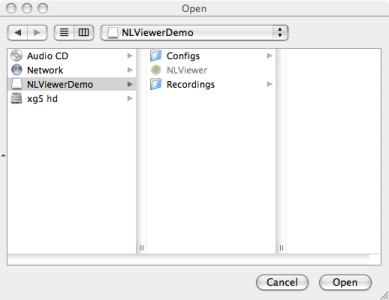
Select the NLViewerDemo volume, and click Open.
The ouline view table will now contain entries corresponding to the directories in the NLViewerDemo volume.
> In the first column of the table, click on the small arrow next to Recordings
The Recordings row expands to display two new items: Other and SIRModel
> Click on the small arrow next to SIRModel.
> Click on the small arrow next to Other.
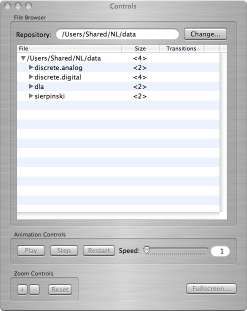
Your table should now look like that in the picture below.
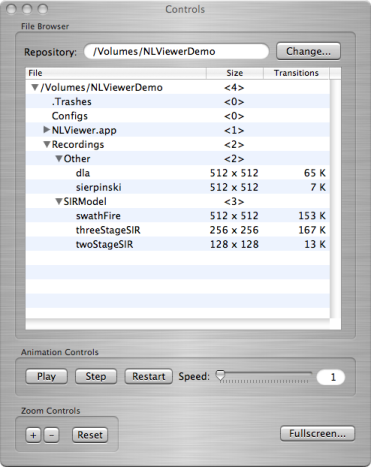
NLViewer after expanding items in the table
The table has three columns, labeled File, Size, and Transitions.
If a row in the table refers to a directory, then:
- the File column gives the path to the directory
- the Size column indicates the number of subdirectories and/or computational runs within the directory. If this number is greater than zero, then a little arrow will appear to the left of the item that can be clicked on to display the directory's contents.
- the Transitions column is blank
If a row in a table refers to a computational run, then:
- the File column gives the name associated with the files of the computational run
- the Size column shows the lattice dimensions
- the Transitions column displays the total number of thousands of times in this computational run that a cell changed its state. The higher the number, the more widespread the epidemic.
Examining the SIRModel recordings
Let's take a look at some of the computations that were recorded with batchrecorder.
> Click on the threeStageSIR row of the table.
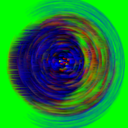
The Viewer window is now updated to display a snapshot of the final state of the computational run you selected. The epidemic has run its course, and now only recovered (blue), susceptible (green), and dead (black) individuals remain. You'll notice that many of the buttons in the Controls window are now enabled.
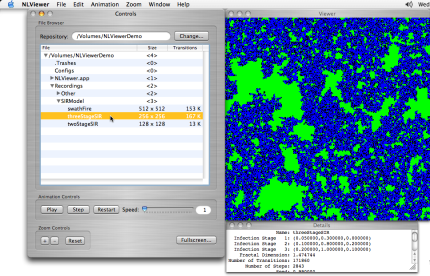
Viewing the final state of a computation
Since the threeStageSIR computation was done on a 256 by 256 grid of cells, NLViewer automatically displays the image at twice its original size
> Click on the Restart button inside the Animation Controls box in the Controls window.
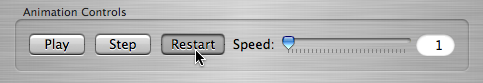
Restarting the recorded computation
The Viewer window now displays a single clump of red and orange cells in the center of the window. These are the initially infected individuals that will seed an epidemic. The colors for infected individuals are as follows:
- Stage 1 infection: Red
- Stage 2 infection: Orange
- Stage 3 infection: Yellow
> Click on the + button inside the Zoom Controls box in the Controls window.
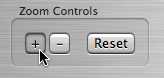
Zooming in
You can zoom in and out to get a closer view.
> While zoomed in, click the mouse somewhere inside of the Viewer window and drag the pointer to a new position.
The red blotch will change position. You can move the image around like this with the mouse to view specific parts of the image close up.
> Click on the Reset button inside the Zoom Controls box in the Controls window.
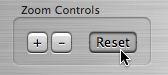
Resetting the zoom
Now the entire lattice is visible in the Viewer window.
> To see the next stage of the epidemic, click on the Step button inside the Animation Controls in the Controls window.
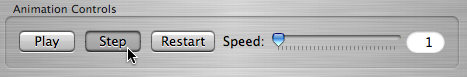
Stepping through the computation
The infection spreads. Orange cells appear, indicating that some individuals have proceeded to the second stage of infection.
> Click on Step two more times to proceed step by step through the playback of the spread of the epidemic.
The infection continues to spread. Yellow cells appear, indicating that some individuals have proceeded to the third stage of infection. In addition, there are now some black cells, representing those that have died during stage 2 or 3 of the infection.
Instead of clicking the button, you can also just press 'S' on the keyboard.
> Move the Speed: slider inside of the Animation Controls box to a new value. Now click on Step again (or press 'S').
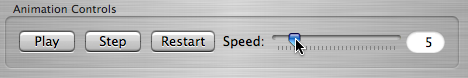
Speeding up the playback
Many frames (the number is specified to the right of the slider) were skipped before updating the display. This way you can speed up the animation.
As the epidemic progresses, blue cells appear, representing those that have recovered from the infection.
> Move the Speed: slider back to 1.
> Now click on the Play button inside the Animation Controls in the Controls Window.
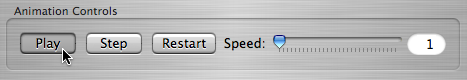
Playing a recorded computation
The Viewer window displays, like a movie, the spread of the epidemic. When no infected individuals remain, the animation stops. Notice that while the animation is playing, the Play button remains depressed. You can stop the animation at any time by pressing the Play button again.
> Click on the Restart button. Now click on the Play button, and then click the Play button once more to stop the animation before it is finished.
You can now click on the Step button to proceed slowly through the animation. You can also zoom in and drag the image around to get a closer look.
Understanding the details window
> Click on the swathFire row of the table in the Controls window.
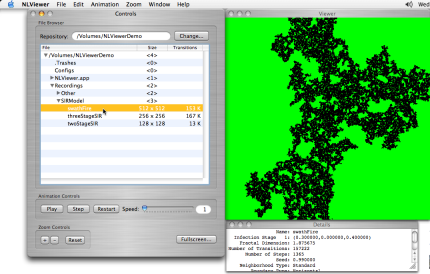
Viewing the final state of the swathFire computation
A different image appears in the Viewer window, showing the final state of an epidemic in which no one survived. This is actually a conflagration model - a model of a forest fire. It is an SIR model with a single infected stage from which no cell recovers. Susceptible cells are perhaps dry trees that will burn if exposed to fire. Infected cells are burning trees, and recovered cells are burnt out trees.
All of this information is available in the Details window.
> Enlarge the Details window to show the information specific to this computation
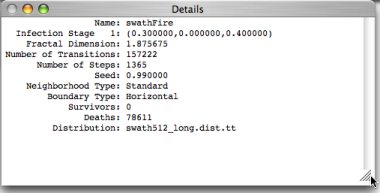
Reading the contents of the Details window
Infection Stage 1: (0.300000,0.000000,0.400000)
The second line of the Details window gives us some information about the infected stage for swathFire.
The first value tells us that at every step the probability of a fire jumping from a burning tree to a susceptible neighboring tree is 0.3.
The second value (0.000000) says that cells never recover (survive) the infection.
The last value (0.400000) says that at every step a burning tree has a 40% chance of burning out.
Other computations may have additional infection stages.
Fractal Dimension: 1.875675
The third line of the Details window shows the measured fractal dimension of the set of susceptible cells (in this case, also the
survival set
) at the end of the computation. This number is obtained using a box-counting method and generally represents the self-similarity of the spreading infection over the space of the lattice.Number of Transitions: 157222
The fourth line of the Details window shows the total number of times a cell changed its state during the course of the computation. This higher this number, the more voracious the disease, depending of course on how many infected stages it has.
Number of Steps: 1365
The total number of steps in this computation.
Seed: 0.990000
The number used to seed the random number generator.
Neighborhood Type: Standard
The neighborhood type determines whether two cells are adjacent.
- The Standard neighborhood says that each cell has four neighbors - North, East, South, and West.
- The Moore's neighborhood says that each cell has eight neighbors - the standard neighbors, plus those that lie catacorner (diagonally adjacent). That is, North, East, South, West as well as Northeast, Northwest, Southeast, and Southwest.
Boundary Type: Horizontal
The boundary type determines how the edge of the grid interacts with the spread of the disease.
- With a Sheet boundary, epidemics are not allowed to spread past the edges of the grid.
- With a Torus boundary, the epidemic can spread past the edges of the grid, wrapping to the opposite side. Topogically, the grid forms a donut.
- A Horizontal boundary allows epidemics to wrap around the top and bottom but prohibits spread across the left and right edges of the grid. Topologically, this is a longer horizontally-aligned cylinder.
- The Vertical boundary allows epidemics to wrap around the left and right but prohibits spread across the left and right edges of the grid. Topologically, this is a longer vertically-aligned cylinder.
Survivors: 0
The number of recovered (blue) cells at the end of the computation.
Deaths: 78611
The number of burnt out (black) trees at the end of the computation.
Distribution: swath512_long.dist.tt
The file used to create the initial distribution of infected individuals.
Using fullscreen mode
> Move the Speed: slider to 3. Click on the Restart button.
We'll now watch this epidemic spread in Fullscreen mode. The image in the Viewer window will fill the screen (and you can no longer read this HTML file!) Since you will no longer have access to the menu or the Controls window, you'll need to use some hotkeys.
The most important hotkey: You can exit Fullscreen mode by pressing Command-F.
> Click on the Fullscreen... button at the bottom right of the Controls window.
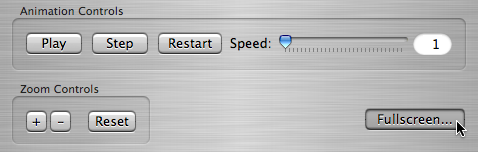
Enabling Fullscreen Mode
The Viewer window grows to fill the screen. You can zoom in by pressing Command-'+', and you can zoom out by pressing Command-'-'. You can still use the mouse to drag the image around.
Additionally, you can start and stop an animation by pressing Command-P. You can Restart the animation by pressing Command-S and you can step through the animation by pressing just 'S'. Press '+' to speed up the animation, and press '-' to slow it down.
> Press Command-F to leave fullscreen mode.
> Take a look at some of the other datasets and get used to using the hotkeys
You will notice that almost all of the commands can also be found in the menu items at the top of the screen, together with their corresponding hotkeys.
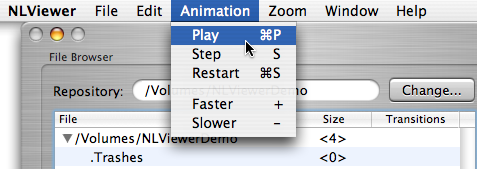
Most commands can be found in the menu, along with their associated hotkey.
Go back to the top or return to the main page.
SIRModel Front End
The Mac OS X frontend for sirmodel simplifies the process of creating one computation using a predefined distribution or a simple radial distribution to be viewed in NLViewer.
The SIRModel Icon
This frontend for SIRModel does not display any graphics relating to the model. Currently it only provides the necessary files to be used with NLViewer.
Contents:
Overview of the Interface
> Download the SIRModel Frontend: SIRFrontend.dmg
Inside this folder you'll find:
- SIRModel Application - The Mac OS Frontend for SIRModel
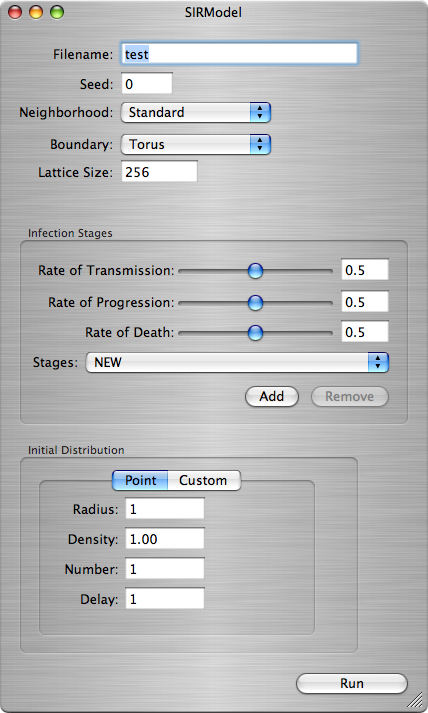
The SIRModel Window
Contents of SIRFrontend.dmg
You must copy this file to your hard drive for the application to be able to output any files, since this application will output any files it makes into a folder named "data". If the folder does not exist, it will be created. Default values will be in place as an example of what kinds of input the application expects.
The first set of arguments are pretty much self explanatory:
- Filename - The name of the file to be outputted.
- Seed - The random seed.
- Neighborhood - Choose either a Standard or Moores type neighborhood for each cell.
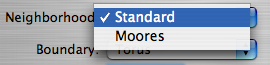
The Neighborhood Menu
- Boundary - Choose whether the boundary wraps around the edges.
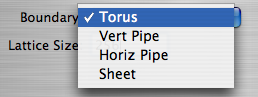
The Boundary Menu
- Lattice Size - The size of the grid.
Setting the Infection Stages
> Adding an Infection Stage
There are three different variables you can set:
- The Rate of Transmission determines how fast the infection is spread to its neighbors.
- The Rate of Progression determines how fast the infection advances to the next stage.
- The Rate of Death determines how fast the infection dies out.
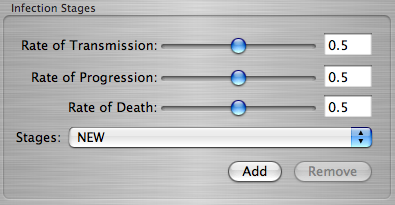
The Infection Stages Box
> Set the values for each of the different rates, then hit the Add button.
You can only add a new infection stage when the item selected is NEW
. If you select an existing infection stage from within the Stages Menu, you will be given a choice to remove or edit that infection stage.
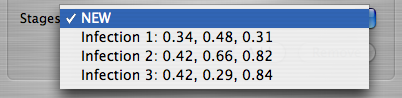
A List of Infection Stages
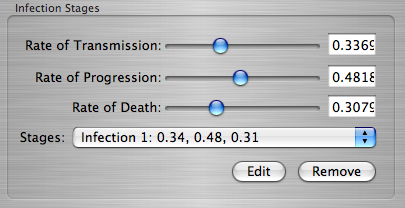
Editing an Infection Stage
When removing an infection stage, the list will collapse so that there will be no gaps between infection stages. For example, if Infection 2
was removed from the list shown above, Infection 3
would become Infection 2
. Add as many or as few infection stages as you would like, but currently the maximum number allowed is 256.
Setting the Initial Distribution
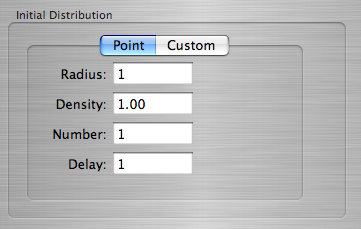
The Initial Distribution Box
There is a choice of 2 types of initial distributions availible:
- A Point Distribution generates a distribution of infections of Infection State 1 around a point according to the following parameters:
- Radius - Determines the size of the point distribution.
- Density - A value between 0 and 1 which determines how many cells are infected within the point.
- Number - The number of point infections created. They are placed randomly if it is greater than 1, and in the center otherwise.
- Delay - The amount of time-steps between each point infection created if Number is greater than 1.
- The Custom Distribution allows you to load a pre-created distribution table. If you supply a file that does not exist, there will be no initial distribution, and you will get an uninteresting computation.
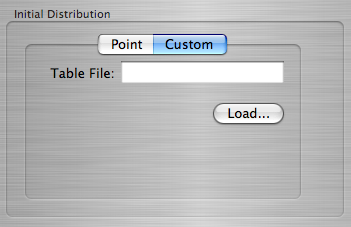
The Custom Distribution Tab